This application performs a basic Cronbach's alpha analysis on data provided by the user.
The data may be supplied as numerical scores or alphabetic scores which are the responses of several individuals (refererred to as persons on this page) to several questions (referred to as items on this page.
Alphabetic scores will be converted to numerical scores as described below.
Options are offered for handling missing responses, also described below.
The application performs the following calculations:
Cronbach raw data alpha value
Cronbach standardized data alpha value
Average of the inter-item correlation coefficients for both raw and standardized data
Average of the inter-item and item totals correlation coefficients for both raw and standardized data
Matrix of the inter-item correlation coefficients for both raw and standardized data
Average and standard deviation of the inter-item correlation coefficients for both raw and standardized data
Means, standard deviations, moment skewnesses, median skewnesses, quartile skewnesess and kurtosis excesses of all items for both raw and standardized data
Minima, maxima, medians, ranges and totals of all items for both raw and standardized data
Means, standard deviations, variances, minima, maxima and ranges of the means, standard deviations, minima, maxima, ranges and totals of all items for both raw and standardized data
Brief analysis of deleting each item in turn (for both raw data and standardized data)
INSTALLING AND RUNNING THE APPLICATION CronbachAnalysis
The Java Development Kit Platform 6 must be installed on your computer or network.
This application creates an instance of, and calls methods from, the Cronbach class facilitating an easily performed basic Cronbach analysis. The Cronbach class is part of the Michael Thomas Flanagan Library. The Michael Thomas Flanagan Library file, flanagan.jar, must be downloaded and installed in the appropriate directory (see Michael Thomas Flanagan Library Main Page).
Download the source file CronbachAnalysis.java into an appropriate folder.
Compile CronbachAnalysis, e.g on PC with a Microsoft Windows XP Operating System:
Open up the Command Prompt Window
Change to the directory in which you have stored CronbachAnalysis.java, e.g. type cd c:\CronbachAnalyses where CronbachAnalyses is the name of that folder on the C drive.
Compile, i.e. type javac CronbachAnalysis.java followed by a return
PREPARING THE DATA FILE
Prepare the input data file. The data file may be stored in any directory. It is not necessary to store it in the same directory as CronbachAnalysis but such storage may be convenient.
The data file must be a text file of the one of the two following formats:
Format one: scores entered as item responses by an individual person, entered as a row
data title
number of items
number of persons
item names (one word each), as a row, e.g. item1 item2 . . . itemn
response of person 1 to item 1 response of person 1 to item 2 . . . response of person 1 to the nth item (all on one line)
response of person 2 to item 1 response of person 1 to item 2 . . . response of person 1 to the nth item (all on one line) . . . .
response of person m to item 1 response of person 1 to item 2 . . . response of person 1 to the nth item (all on one line)
where there are n items and m persons.
The item names must be single words. Each response may be a floating point number, an integer number, a single word or a single letter. The item names and responses must be separated from any preceding and/or any following number or word by a single space or several spaces, a comma, a tab, a semicolon, colon or end of line. See Response Representation (below) for a detailed description of allowed response representations. See Missing Response (below under Response Representation) for a detailed description of how a missing response may be represented. All responses for an individual person must be on the same line.
or
Format two: scores entered as responses to an individual item by the persons responding, entered as a row
data title
number of items
number of persons
item names (one word each), as a row, e.g. item1 item2 . . . itemn
response to item 1 by person 1 response to item 1 by person 2 . . . response to item 1 by the mth person (all on one line)
response to item 2 by person 1 response to item 2 by person 2 . . . response to item 2 by the mth person(all on one line) . . . .
response to item n by person 1 response to item n by person 2 . . . response to item n by the mth person (all on one line)
where there are n items and m persons.
The item names must be single words. Each response may be a floating point number, an integer number, a single word or a single letter. The item names and responses must be separated from any preceding and/or any following number or word by a single space or several spaces, a comma, a tab, a semicolon, colon or end of line. See Response Representation (below) for a detailed description of allowed response representations. See Missing Response (below under Response Representation) for a detailed description of how a missing response may be represented. All responses for an item must be on the same line.
floating point numbers, e.g. 2.34, 5.8, -8.91, 0.635 . . . [Use the E format for very large and very small numbers, e.g. 1.56E+17 for 1.56x10¹⁷, -7.854E-09 for -7.854x10⁻⁹]
single letters, e.g. A, B, C, D . . . , a, b, c, d, . . .
true or false, True or False, TRUE or FALSE
yes or no, Yes or No, YES or NO
The response input methods are case insensitive. Response types may be mixed within a data file but should be of the same type within an individual item. See Example Programs for examples of mixed type data files.
Non-numerical representations of responses are converted to numerical values as follows:
NO, No, and no —> -1.0
N and n, if part of a YN dichotomous pair [N Y, n y, N y or nY] —> -1.0 otherwise —> 14.0
YES, Yes, or yes —> +1.0
Y and y, if part of a YN dichotomous pair [N Y, n y, N y or nY] —> +1.0 otherwise —> 21.0
FALSE, False, and false —> -1.0
TRUE, True, and true —> +1.0
A and a —> 1.0, B and b —> 2.0, C and c —> 3.0, . . . etc.
Missing Responses
A missing response may be represented by any word or letter, preferably a word, e.g. abs or missing, not listed above as a valid response. If a missing response is represented by a word, eg, abs, missing, any of the separators, used to separate the responses in the data file, i.e. space, comma, a tab, a semicolon, colon or end of line, may be used. If a missing response is represented by a space that space MUST be preceded and followed by a comma, a tab, a semicolon, colon or end of line, i.e. in this case a space cannot also be used as a separator.
See box three, box four and box five (below) for the options on dealing with a missing response in the alpha coefficient calculations.
Example data file: CronbachDataOne.txt, using spaces as separators.
Example data file: CronbachDataTwo.txt, using spaces as separators with missing responses.
Example data file: CronbachDataThree.txt, using commas as separators and spaces for missing responses.
The data files are described in detail in Example Programs.
RUNNING CronbachAnalysis
Run CronbachAnalysis, e.g on PC with a Microsoft Operating System:
Open up the Command Prompt Window
Change to the directory in which you have stored CronbachAnalysis.java, e.g. type cd c:\CronbachAnalyses where CronbachAnalyses is the name of that folder on the C drive.
Run, i.e. type java CronbachAnalysis followed by a return
A series of information or dialogue boxes will then appear sequentially. All you need to do is respond`to each box in turn. Pressing the ‘enter’ key will close the box selecting the default option, i.e. the button with the bold outline or the value or text in the text box.
Box one: Information box
The first box is an information message identifying the Program that you have initiated. Click on the OK button when you have read the message.
Box two: Identifying data format
The second box is a dialogue box asking whether the data in the input file is organised as
scores entered as item responses by an individual person, entered as a row (format one above)
or
scores entered as responses to an individual item by the persons responding, entered as a row (format two above)
Click on the appropriate button
Box three: Missing responses: replacement option
This dialogue box requests you to select an option for dealing with missing responses. The options are:
1. the missing response is replaced by zero
2. the missing response is replaced by the mean of that person's respones
3. the missing response is replaced by the mean of the responses to that item. This is the default option
4. the missing response is replaced by the overall mean
5. the missing response is replaced by a user supplied score for each missing response. A value will be requested, via a dialogue box, each time a missing response is encounterd as the data is processed
Box four: Missing responses: person deletion options
This input box requests you enter the person deletion percentage (pdpc), i.e. the percentage of missing responses in an individual person's responses that is tolerated. If that person has a greater percentage of missing responses that person will be deleted from the analysis, e.g.
A value of 0.0 will lead to a person being deleted on missing a single response.
A value of 50.0 will lead to a person being deleted on missing more than 50% of the response.
A value of 100.0 will ensure that a person is only deleted if that person fails to make any responses.
See also box three and box five
Box five: Missing responses: item deletion options
This input box requests you enter the item deletion percentage (idpc), i.e. the percentage of missing responses to an individual item that is tolerated. If that item has a greater percentage of missing responses that item will be deleted from the analysis, e.g.
A value of 0.0 will lead to an item being deleted on one person missing a response to that item.
A value of 50.0 will lead to an item being deleted on more than 50% of individual persons failing to respond to that item.
A value of 100.0 will ensure that an item is only deleted if no persons respond to that item.
See also box three and box four
Box six: Selection of the input data file
This file slection window allows you to select the data file you wish to analyse.
This window opens displaying the contents of the current directory, i.e. the directory in which you have stored CronbachAnalaysis.java, but you can use this window to browse any directory on your computer if you have not stored your data files in the current directory.
Box seven: Selection of the output file type
This dialogue box requests you to select the type of output file that you require. The options are:
Text File (.txt)
Excel Readable File (.xls)
This file can be read by Microsoft Excel as if it were an Excel file. Excel will nonetheless ask you to confirm that you do wish Excel to read this file.
The output file contains the following Cronbach analysis results:
Title
Name of input file if data read from a text file
Time and date of program execution
Cronbach raw data alpha value
Cronbach standardized data alpha value
Average of the inter-item correlation coefficients for both raw and standardized data
Average of the inter-item and item totals correlation coefficients for both raw and standardized data
Person deletion indices if any deletion of persons
Item deletion indices if any deletion of items
Replacement response indices and the replacement option chosen if any missing responses replaced
Number of items and of persons used in the analysis
Matrix of the inter-item correlation coefficients for the raw data
Average and standard deviation of the inter-item correlation coefficients for raw data
Matrix of the inter-item correlation coefficients for the standardized data
Average and standard deviation of the inter-item correlation coefficients for standardized data
Means, standard deviations, moment skewnesses, median skewnesses, quartile skewnesess and kurtosis excesses of all items for the raw data
Minima, maxima, medians, ranges and totals of all items for the raw data
Means, standard deviations, variances, minima, maxima and ranges of the means, standard deviations, minima, maxima, ranges and totals of all items for the standardized data
Means, standard deviations, moment skewnesses, median skewnesses, quartile skewnesess and excess kurtoses of all items for the standardized data
Minima, maxima, medians, ranges and totals of all items for the raw data
Means, standard deviations, variances, minima, maxima and ranges of the means, standard deviations, minima, maxima, ranges and totals of all items for the standardized data
Brief analysis of deleting each item in turn (for both raw data and standardized data) presented as
Deleted item
Cronbach alpha calculated without the deleted item
Correlation coefficient of the the deleted item with the item totals in the absence of the deleted item
Average inter-item correlation coefficient in the absence of the deleted item
Average inter-item correlation coefficient including item totals in the absence of the deleted item
Means, standard deviations, minima, maxima, ranges, totals and responses to each item for all persons for the raw data
Means, standard deviations, minima, maxima, ranges, totals and responses to each item for all persons for the standardized data
Mean, standard deviation, minimum, maximum, range and overall total of all responses for the raw data
Mean, standard deviation, minimum, maximum, range and overall total of all responses for the standardized data
A second output file is also produced that may be used as the input file for a further analysis by CronbachAnalysis. This file is the original data with the least consistent item deleted. This file will contain:
an appropriate title
the new numbers of items after deletion of the least consistent item
the number of persons
the item names minus the least consistent item name
the responses minus those of the least consistent item. These will be written using the same (row per item)/(row per person) format used in the input of original data
The least consistent item is chosen by a majority voting procedure applied to the raw and standardized data alpha coefficients and correlation coefficients with the item totals. If there is an even split between the raw and standardized data the standardized data decision is chosen. Commonly, all four criteria indicate the deletion of the same item.
Box eight: Request for the output file name
This input box requests you to enter the name of output file. The default name is the name of the input file with Analysis added as a suffix, e.g. an input file named CronbachDataOne.txt gives a default name for the output file as CronbachDataOneAnalysis.txt.
The data file prepared with the data for the least consistent item deleted is given the name of the input file with the suffix _itemx_deleted added where x is the number of the deleted item, e.g. CronbachDataOne_item3_deleted.txt (CronbachDataOne_item3_deleted.txt).
Box nine: Information box
This information box gives the calculated values of Cronbach's alpha coefficient and the names of the output files.
Box ten: Scatter plots option
This dialogue box gives you the option of displaying scatter plots. If you click on the YES button the following sets of scatter plots will be displayed:
Scatter plots of the standardized data for all pairs of items
Scatter plots of the standardized data of each item plotted against the mean values of all items
If you choose this option you need to end the program later by clicking on the close icon (white cross on red background in the top right hand corner) on any of the plots or, if using a Microsoft operating system, typing Control C in the command prompt window.
Clicking on the NO button ends the program.
The output files are created in the directory in which you compiled CronbachAnalysis unless you included an alternative path in a supplied output file name.
EXAMPLE PROGRAMS
No Missing Responses Example Program Data File
The example data file has the following lines:
a title [Cronbach Example Data One]
responses to 7 items [7]
responses from 23 individuals [23]
a row of the item names, simply called item1 ...., in this example
23 rows of the responses of each individual person to the 7 items
The responses to item1 are within an integer range 30 to 45 inclusive
The responses to item2 are within an integer range 1 to 5 inclusive
The responses to item3 are true or false
The responses to item4 are A, B, C, D or E
The responses to item5 are either 1 or 2
The responses to item6 are either yes or no
The responses to item7 are within a floating point range -2.6 to 8.3 inclusive
Example Program Output File
The output file, produced on running the CronbachAnalysis application with the above input data,CronbachDataOne.txt, may be accessed through CronbachDataOneAnalysis.txt
With Missing Responses
The data file CronbachDataTwo.txt contains missing data indicated by the word abs or the word missing.
The output file, produced on running the CronbachAnalysis application with the input data, CronbachDataTwo.txt, and with:
the missing response replacement option: replace a missing data point by the item mean
Cronbach's alpha coefficient is a measure of the relationship between the observed scores in a group of persons responses to a set of questions (items) and the true score, i.e. the score that would be obtained if the scores were not contaminated with noise, e.g. fortuitous guessing in the absence of knowledge of the true response. A consistent set of items should minimize this difference which will be reflected in a high value for Cronbach's alpha coefficient. The errors in the scores should be random and uncorrelated with each other and the items should be tau-equivalent. In practice these requirements are rarely fully satisfied.
Cronbach's alpha consistency coefficient, α, is defined as
where s2i are the estimates of the variances of the n items and s2sum is the variance of the sum of all items. This coefficient may be returned calculated for the raw input data or calculated for data in which all the scores of each item have been standardized, i.e.
where zi,j is the standardized data response of the ith person to the jth item, xi,j is the raw data response of the ith person to the jth item, 
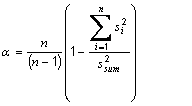
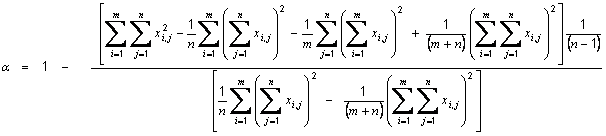
is the mean of the raw data responses in item j and sj is the standard deviation of the raw data responses in item j.
Raw Data Alpha Consistency Coefficient
The raw data coefficient, α, is calculated as:
where xi,j is the response of the ith person to the jth item, m is the number of persons and n is the number of items.
Standardized Data Alpha Consistency Coefficient
The standardized data coefficient, α, is calculated as:
where 
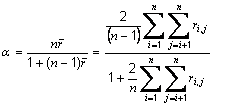
is the average off all Pearson correlation coefficients between items, ri,j is the correlation coefficient between item i and item j and n is the number of items.
BIBLIOGRAPHY
Cronbach, L. J. (1951), Coefficient alpha and the internal structure of tests, Psychometrika, 16(3), 297-334.
Cohen, L., Manion, L. & Morrison, K, A. (2008), Research Methods in Education, 6th Edition, Routledge, London & New York, Chapter Six, Validity and reliability, pp 132-164.
Allen, K., Reed-Rhoads, T., Terry, R. A., Murphy, T. J. & Stone, A. D. (2008), Coefficient Alpha: An Engineer's Interpretation of Test Reliability, Journal of Engineering Education, 97(1), 87-94.
See also Cronbach class, the class underpinning this application, for a more detailed description of the methods called by this application.
CLASSES IN THIS LIBRARY USED BY THIS APPLICATION
This application uses the following classes in this library: