|
|
|
| Constructors | Unweighted Regression |
public ProbabilityPlot(double[] dataArray) | |
|
public ProbabilityPlot(Double[] dataArray) | |||
|
public ProbabilityPlot(float[] dataArray) | |||
|
public ProbabilityPlot(Float[] dataArray) | |||
|
public ProbabilityPlot(int[] dataArray) | |||
|
public ProbabilityPlot(Integer[] dataArray) | |||
|
public ProbabilityPlot(long[] dataArray) | |||
|
public ProbabilityPlot(Long[] dataArray) | |||
|
public ProbabilityPlot(short[] dataArray) | |||
|
public ProbabilityPlot(Short[] dataArray) | |||
|
public ProbabilityPlot(byte[] dataArray) | |||
|
public ProbabilityPlot(Byte[] dataArray) | |||
|
public ProbabilityPlot(BigDecimal[] dataArray) | |||
|
public ProbabilityPlot(BigInteger[] dataArray) | |||
|
public ProbabilityPlot(ArrayMaths dataArray) | |||
|
public ProbabilityPlot(ArrayList<Object> dataArray) | |||
|
public ProbabilityPlot(Vector<Object> dataArray) | |||
|
public ProbabilityPlot(Stat dataArray) | Weighted Regression |
public ProbabilityPlot(double[] dataArray, double[] weights) |
|
|
public ProbabilityPlot(Double[] dataArray, Double[] weights) | |||
|
public ProbabilityPlot(float[] dataArray, float[] weights) | |||
|
public ProbabilityPlot(Float[] dataArray, Float[] weights) | |||
|
public ProbabilityPlot(int[] dataArray, int[] weights) | |||
|
public ProbabilityPlot(Integer[] dataArray, Integer[] weights) | |||
|
public ProbabilityPlot(long[] dataArray, long[] weights) | |||
|
public ProbabilityPlot(Long[] dataArray, Long[] weights) | |||
|
public ProbabilityPlot(short[] dataArray, short[] weights) | |||
|
public ProbabilityPlot(Short[] dataArray, Short[] short) | |||
|
public ProbabilityPlot(byte[] dataArray, byte[] weights) | |||
|
public ProbabilityPlot(Byte[] dataArray, Byte[] weights) | |||
|
public ProbabilityPlot(BigDecimal[] dataArray, BigDecimal[] weights) | |||
|
public ProbabilityPlot(BigInteger[] dataArray, BigInteger[] weights) | |||
|
public ProbabilityPlot(ArrayMaths dataArray, ArrayMaths weights) | |||
|
public ProbabilityPlot(ArrayList<Object> dataArray, ArrayList<Object> weights) | |||
|
public ProbabilityPlot(Vector<Object> dataArray, Vector<Object> weights) | |||
|
public ProbabilityPlot(Stat dataArray, Stat weights) | |||
| Alternative Weighting Options | Set weighting option | public void setWeightingOption(int option) | |
| Get weighting option | public String getWeightingOption() | ||
| Suppress display of the plot | Suppress display | public void suppressDisplay() | |
| Restore display | public void restoreDisplay() | ||
| Gaussian Probability Plot (Normal Probability Plot) See below for the Standard Gaussian Probability Plot |
Calculate and display plot | public void gaussianProbabiltyPlot() | |
| User supplied initial estimates | public void gaussianUserSuppliedInitialEstimates(double mu, double sigma) | ||
| Remove user supplied initial estimates | public void removeGaussianUserSuppliedInitialEstimates() | ||
| Correlation coefficient | public double gaussianCorrelationCoefficient() | ||
| Gradient | value | public double gaussianGradient() | |
| error | public double gaussianGradientError() | ||
| Intercept | value | public double gaussianIntercept() | |
| error | public double gaussianInterceptError() | ||
| μ | value | public double gaussianMu() | |
| error | public double gaussianMuError() | ||
| σ | value | public double gaussianSigma() | |
| error | public double gaussianSigmaError() | ||
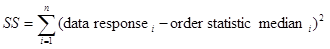
| Sum of squares | Unweighted | public double gaussianSumOfSquares() | |
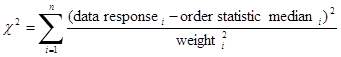
| Weighted | public double gaussianWeightedSumOfSquares() | ||
| Order Statistic Medians | public double[] gaussianOrderStatisticMedians() | ||
| Standard Gaussian Probability Plot (Normal Probability Plot) See above for the Two Parameter Gaussian Probability Plot |
Calculate and display plot | public void gaussianStandardProbabiltyPlot() | |
| Correlation coefficient | public double gaussianStandardCorrelationCoefficient() | ||
| Gradient | value | public double gaussianStandardGradient() | |
| error | public double gaussianStandardGradientError() | ||
| Intercept | value | public double gaussianStandardIntercept() | |
| error | public double gaussianStandardInterceptError() | ||
| Sum of squares | Unweighted | public double gaussianStandardSumOfSquares() | |
| Weighted | public double gaussianStandardWeightedSumOfSquares() | ||
| Order Statistic Medians | public double[] gaussianStandardOrderStatisticMedians() | ||
| Exponential Probability Plot | Calculate and display plot | public void exponentialProbabiltyPlot() | |
| User supplied initial estimates | public void exponentialUserSuppliedInitialEstimates(double mu, double sigma) | ||
| Remove user supplied initial estimates | public void removeExponentialUserSuppliedInitialEstimates() | ||
| Correlation coefficient | public double exponentialCorrelationCoefficient() | ||
| Gradient | value | public double exponentialGradient() | |
| error | public double exponentialGradientError() | ||
| Intercept | value | public double exponentialIntercept() | |
| error | public double exponentialInterceptError() | ||
| μ | value | public double exponentialMu() | |
| error | public double exponentialMuError() | ||
| σ | value | public double exponentialSigma() | |
| error | public double exponentialSigmaError() | ||
| Sum of squares | Unweighted | public double exponentialSumOfSquares() | |
| Weighted | public double exponentialWeightedSumOfSquares() | ||
| Order Statistic Medians | public double[] exponentialOrderStatisticMedians() | ||
| F-Distribution Probability Plot | Calculate and display plot | public void fDistributionProbabiltyPlot(int nu1, int nu2) | |
| Correlation coefficient | public double fDistributionCorrelationCoefficient() | ||
| Gradient | value | public double fDistributionGradient() | |
| error | public double fDistributionGradientError() | ||
| Intercept | value | public double fDistributionIntercept() | |
| error | public double fDistributionInterceptError() | ||
| Sum of squares | Unweighted | public double fDistributionSumOfSquares() | |
| Weighted | public double fDistributionWeightedSumOfSquares() | ||
| Order Statistic Medians | public double[] fDistributionOrderStatisticMedians() | ||
| Fréchet Probability Plot (Three Parameters) See below for the Two Parameter Fréchet and the Standard Fréchet Probability Plots |
Calculate and display plot | public void frechetProbabiltyPlot() | |
| User supplied initial estimates | public void frechetUserSuppliedInitialEstimates(double mu, double sigma, double gamma) | ||
| Remove user supplied initial estimates | public void removeFrechetUserSuppliedInitialEstimates() | ||
| Correlation coefficient | public double frechetCorrelationCoefficient() | ||
| Gradient | value | public double frechetGradient() | |
| error | public double frechetGradientError() | ||
| Intercept | value | public double frechetIntercept() | |
| error | public double frechetInterceptError() | ||
| μ | value | public double frechetMu() | |
| error | public double frechetMuError() | ||
| σ | value | public double frechetSigma() | |
| error | public double frechetSigmaError() | ||
| γ | value | public double frechetGamma() | |
| error | public double frechetGammaError() | ||
| Sum of squares | Unweighted | public double frechetSumOfSquares() | |
| Weighted | public double frechetWeightedSumOfSquares() | ||
| Order Statistic Medians | public double[] frechetOrderStatisticMedians() | ||
| Two parameter Fréchet Probability Plot See above for Three Parameter Fréchet Plot See below for Standard Fréchet Plot |
Calculate and display plot | public void frechetTwoParProbabiltyPlot() | |
| User supplied initial estimates | public void frechetTwoParUserSuppliedInitialEstimates(double sigma, double gamma) | ||
| Remove user supplied initial estimates | public void removeFrechetTwoParUserSuppliedInitialEstimates() | ||
| Correlation coefficient | public double frechetTwoParCorrelationCoefficient() | ||
| Gradient | value | public double frechetTwoParGradient() | |
| error | public double frechetTwoParGradientError() | ||
| Intercept | value | public double frechetTwoParIntercept() | |
| error | public double frechetTwoParInterceptError() | ||
| σ | value | public double frechetTwoParSigma() | |
| error | public double frechetTwoParSigmaError() | ||
| γ | value | public double frechetTwoParGamma() | |
| error | public double frechetTwoParGammaError() | ||
| Sum of squares | Unweighted | public double frechetTwoParSumOfSquares() | |
| Weighted | public double frechetTwoParWeightedSumOfSquares() | ||
| Order Statistic Medians | public double[] frechetTwoParOrderStatisticMedians() | ||
| Standard Fréchet Probability Plot See above for Three Parameter Fréchet and Two Parameter Fréchet Probability Plots |
Calculate and display plot | public void frechetStandardProbabiltyPlot() | |
| User supplied initial estimates | public void frechetStandardUserSuppliedInitialEstimates(double gamma) | ||
| Remove user supplied initial estimates | public void removeFrechetStandardUserSuppliedInitialEstimates() | ||
| Correlation coefficient | public double frechetStandardCorrelationCoefficient() | ||
| Gradient | value | public double frechetStandardGradient() | |
| error | public double frechetStandardGradientError() | ||
| Intercept | value | public double frechetStandardIntercept() | |
| error | public double frechetStandardInterceptError() | ||
| γ | value | public double frechetStandardGamma() | |
| error | public double frechetStandardGammaError() | ||
| Sum of squares | Unweighted | public double frechetStandardSumOfSquares() | |
| Weighted | public double frechetStandardWeightedSumOfSquares() | ||
| Order Statistic Medians | public double[] frechetStandardOrderStatisticMedians() | ||
| Gumbel (minimum order statistic) Probability Plot | Calculate and display plot | public void gumbelMinProbabiltyPlot() | |
| User supplied initial estimates | public void gumbelMinUserSuppliedInitialEstimates(double mu, double sigma) | ||
| Remove user supplied initial estimates | public void removeGumbelMinUserSuppliedInitialEstimates() | ||
| Correlation coefficient | public double gumbelMinCorrelationCoefficient() | ||
| Gradient | value | public double gumbelMinGradient() | |
| error | public double gumbelMinGradientError() | ||
| Intercept | value | public double gumbelMinIntercept() | |
| error | public double gumbelMinInterceptError() | ||
| μ | value | public double gumbelMinMu() | |
| error | public double gumbelMinMuError() | ||
| σ | value | public double gumbelMinSigma() | |
| error | public double gumbelMinSigmaError() | ||
| Sum of squares | Unweighted | public double gumbelMinSumOfSquares() | |
| Weighted | public double gumbelMinWeightedSumOfSquares() | ||
| Order Statistic Medians | public double[] gumbelMinOrderStatisticMedians() | ||
| Gumbel (maximum order statistic) Probability Plot | Calculate and display plot | public void gumbelMaxProbabiltyPlot() | |
| User supplied initial estimates | public void gumbelMaxUserSuppliedInitialEstimates(double mu, double sigma) | ||
| Remove user supplied initial estimates | public void removeGumbelMaxUserSuppliedInitialEstimates() | Correlation coefficient | public double gumbelMaxCorrelationCoefficient() |
| Gradient | value | public double gumbelMaxGradient() | |
| error | public double gumbelMaxGradientError() | ||
| Intercept | value | public double gumbelMaxIntercept() | |
| error | public double gumbelMaxInterceptError() | ||
| μ | value | public double gumbelMaxMu() | |
| error | public double gumbelMaxMuError() | ||
| σ | value | public double gumbelMaxSigma() | |
| error | public double gumbelMaxSigmaError() | ||
| Sum of squares | Unweighted | public double gumbelMaxSumOfSquares() | |
| Weighted | public double gumbelMaxWeightedSumOfSquares() | ||
| Order Statistic Medians | public double[] gumbelMaxOrderStatisticMedians() | ||
| Logistic Probability Plot | Calculate and display plot | public void logisticProbabiltyPlot() | |
| User supplied initial estimates | public void logisticUserSuppliedInitialEstimates(double mu, double beta) | ||
| Remove user supplied initial estimates | public void removeLogisticUserSuppliedInitialEstimates() | ||
| Correlation coefficient | public double logisticCorrelationCoefficient() | ||
| Gradient | value | public double logisticGradient() | |
| error | public double logisticGradientError() | ||
| Intercept | value | public double logisticIntercept() | |
| error | public double logisticInterceptError() | ||
| μ | value | public double logisticMu() | |
| error | public double logisticMuError() | ||
| β | value | public double logisticBeta() | |
| error | public double logisticBetaError() | ||
| Sum of squares | Unweighted | public double logisticSumOfSquares() | |
| Weighted | public double logisticWeightedSumOfSquares() | ||
| Order Statistic Medians | public double[] logisticOrderStatisticMedians() | ||
| Pareto Probability Plot | Calculate and display plot | public void paretoProbabiltyPlot() | |
| User supplied initial estimates | public void paretoUserSuppliedInitialEstimates(double alpha, double beta) | ||
| Remove user supplied initial estimates | public void removeParetoUserSuppliedInitialEstimates() | ||
| Correlation coefficient | public double paretoCorrelationCoefficient() | ||
| Gradient | value | public double paretoGradient() | |
| error | public double paretoGradientError() | ||
| Intercept | value | public double paretoIntercept() | |
| error | public double paretoInterceptError() | ||
| α | value | public double paretoAlpha() | |
| error | public double paretoAlphaError() | ||
| β | value | public double paretoBeta() | |
| error | public double paretoBetaError() | ||
| Sum of squares | Unweighted | public double paretoSumOfSquares() | |
| Weighted | public double paretoWeightedSumOfSquares() | ||
| Order Statistic Medians | public double[] paretoOrderStatisticMedians() | ||
| Rayleigh Probability Plot | Calculate and display plot | public void rayleighProbabiltyPlot() | |
| User supplied initial estimates | public void rayleighUserSuppliedInitialEstimates(double beta) | ||
| Remove user supplied initial estimates | public void removeRayleighUserSuppliedInitialEstimates() | ||
| Correlation coefficient | public double rayleighCorrelationCoefficient() | ||
| Gradient | value | public double rayleighGradient() | |
| error | public double rayleighGradientError() | ||
| Intercept | value | public double rayleighIntercept() | |
| error | public double rayleighInterceptError() | ||
| β | value | public double rayleighBeta() | |
| error | public double rayleighBetaError() | ||
| Sum of squares | Unweighted | public double rayleighSumOfSquares() | |
| Weighted | public double rayleighWeightedSumOfSquares() | ||
| Order Statistic Medians | public double[] rayleighOrderStatisticMedians() | ||
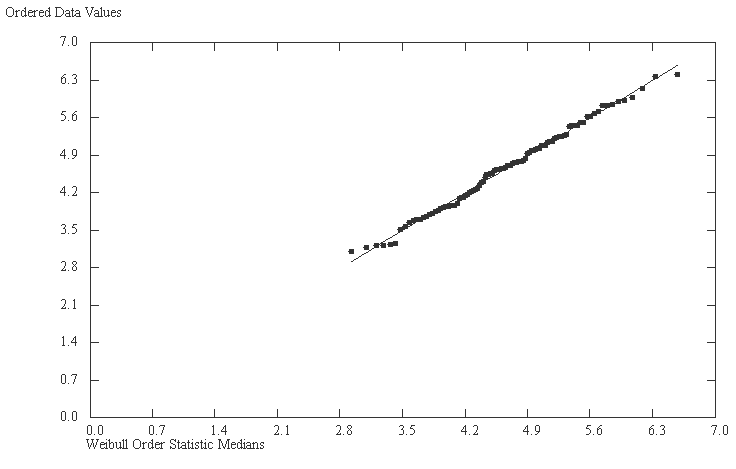
| Weibull Probability Plot (Three Parameters) See below for the Two Parameter Weibull and the Standard Weibull Probability Plots |
Calculate and display plot | public void weibullProbabiltyPlot() | |
| User supplied initial estimates | public void weibullUserSuppliedInitialEstimates(double mu, double sigma, double gamma) | ||
| Remove user supplied initial estimates | public void removeWeibullUserSuppliedInitialEstimates() | ||
| Correlation coefficient | public double weibullCorrelationCoefficient() | ||
| Gradient | value | public double weibullGradient() | |
| error | public double weibullGradientError() | ||
| Intercept | value | public double weibullIntercept() | |
| error | public double weibullInterceptError() | ||
| μ | value | public double weibullMu() | |
| error | public double weibullMuError() | ||
| σ | value | public double weibullSigma() | |
| error | public double weibullSigmaError() | ||
| γ | value | public double weibullGamma() | |
| error | public double weibullGammaError() | ||
| Sum of squares | Unweighted | public double weibullSumOfSquares() | |
| Weighted | public double weibullWeightedSumOfSquares() | ||
| Order Statistic Medians | public double[] weibullOrderStatisticMedians() | ||
| Two parameter Weibull Probability Plot See above for Three Parameter Weibull Plot See below for Standard Weibull Plot |
Calculate and display plot | public void weibullTwoParProbabiltyPlot() | |
| User supplied initial estimates | public void weibullTwoParUserSuppliedInitialEstimates(double sigma, double gamma) | ||
| Remove user supplied initial estimates | public void removeWeibullTwoParUserSuppliedInitialEstimates() | ||
| Correlation coefficient | public double weibullTwoParCorrelationCoefficient() | ||
| Gradient | value | public double weibullTwoParGradient() | |
| error | public double weibullTwoParGradientError() | ||
| Intercept | value | public double weibullTwoParIntercept() | |
| error | public double weibullTwoParInterceptError() | ||
| σ | value | public double weibullTwoParSigma() | |
| error | public double weibullTwoParSigmaError() | ||
| γ | value | public double weibullTwoParGamma() | |
| error | public double weibullTwoParGammaError() | ||
| Sum of squares | Unweighted | public double weibullTwoParSumOfSquares() | |
| Weighted | public double weibullTwoParWeightedSumOfSquares() | ||
| Order Statistic Medians | public double[] weibullTwoParOrderStatisticMedians() | ||
| Standard Weibull Probability Plot See above for Three Parameter Weibull and Two Parameter Weibull Probability Plots |
Calculate and display plot | public void weibullStandardProbabiltyPlot() | |
| User supplied initial estimates | public void weibullStandardUserSuppliedInitialEstimates(double gamma) | ||
| Remove user supplied initial estimates | public void removeWeibullStandardUserSuppliedInitialEstimates() | ||
| Correlation coefficient | public double weibullStandardCorrelationCoefficient() | ||
| Gradient | value | public double weibullStandardGradient() | |
| error | public double weibullStandardGradientError() | ||
| Intercept | value | public double weibullStandardIntercept() | |
| error | public double weibullStandardInterceptError() | ||
| γ | value | public double weibullStandardGamma() | |
| error | public double weibullStandardGammaError() | ||
| Sum of squares | Unweighted | public double weibullStandardSumOfSquares() | |
| Weighted | public double weibullStandardWeightedSumOfSquares() | ||
| Order Statistic Medians | public double[] weibullStandardOrderStatisticMedians() | ||
| Common methods | Critical value for the correlation coefficients | public double correlationCoefficientCriticalValue() | |
| public double correlationCoefficientCriticalValue(double significance) | |||
| Significance level | public void resetSignificance(double significance) | ||
| public double getSignificance() | |||
| Ordered data array | public double[] orderedData() | ||
| Number of data points | public int numberOfDataPoints() | ||
| Data mean | public double mean() | ||
| Data standard deviation | public double standardDeviation() | ||
| Data minimum | public double minimum() | ||
| Data maximum | public double maximum() | ||
| Return initial estimates | public double[] getInitialEstimates() | ||
| Simplex step size factor | Current value | public double stepFactor() | |
| Reset value | public void resetStepFactor(double stepFactor) | ||
| Numerical differentiation step, δ |
Current value | public double delta() | |
| Reset value | public void resetDelta(double delta) | ||
| Standard deviation denominator |
Set to n | public void setDenominatorToN() | |
| Set to n-1 | public void setDenominatorToNminusOne() | ||
| Suppress the display of the plot | public void suppressDisplay() | ||
| Restore the display of the plot | public void restoreDisplay() | ||
| Suppress the output to a text file | public void suppressFileOutput() | ||
| Restore the the output to a text file | public void restoreFileOutput() | ||
| Suppress some error messages | public void suppressErrorMessages() | ||
| Restore suppressed error messages | public void restoreErrorMessages() | ||