| Constructors
|
public Outliers() |
| public Outliers(double[] data) |
| public Outliers(float[] data) |
| public Outliers(long[] data) |
| public Outliers(int[] data) |
| public Outliers(BigDecimal[] data) |
| public Outliers(BigInteger[] data) |
| Read data in from a text file
|
public void readDataFromTextFile()
|
|
Significance |
Reset the significance level
|
public void resetSignificance(double significance)
|
|
Get the significance level
|
public double getSignificance()
|
|
Output text file |
Reset the file name
|
public void resetTextFileName(String filename)
|
|
Supress print to text file
|
public void suppressPrint()
|
|
Restore print to text file
|
public void restorePrint()
|
|
Display Probability Plots |
Suppress display
|
public void suppressDisplay()
|
|
Restore display
|
public void restoreDisplay()
|
|
Grubbs’ Test
|
Instant methods
|
public ArrayList<Object> outlierGrubbs()
|
|
public ArrayList<Object> lowerOutlierGrubbs()
|
|
public ArrayList<Object> upperOutlierGrubbs()
|
|
public double getGrubbsOneTailedCriticalT() |
|
public double getGrubbsTwoTailedCriticalT() |
|
Static methods
|
public static ArrayList<Object> outlierGrubbs(double[] data)
|
|
public static ArrayList<Object> lowerOutlierGrubbs(double[] data)
|
|
public static ArrayList<Object> upperOutlierGrubbs(double[] data)
|
|
public static double getGrubbsOneTailedCriticalT(double significance, int nObservations) |
|
public static double getGrubbsTwoTailedCriticalT(double significance, int nObservations) |
|
Tietjen-Moore Test
|
Instant methods
|
public ArrayList<Object> outliersTietjenMoore(int nOutliers)
|
|
public ArrayList<Object> lowerOutliersTietjenMoore(int nOutliers)
|
|
public ArrayList<Object> upperOutliersTietjenMoore(int nOutliers)
|
|
public double getTietjenMooreCriticalL(int nOutliers) |
|
public double getTietjenMooreLowerCriticalL(int nOutliers) |
|
public double getTietjenMooreUpperCriticalL(int nOutliers) |
|
Number of simulations
|
public void resetNumberTietjenMooreSimulations(int nSimulations) |
|
public int getNumberTietjenMooreSimulations() |
|
Static methods
|
public static ArrayList<Object> outliersTietjenMoore(double[] data, int nOutliers)
|
|
public static ArrayList<Object> lowerOutliersTietjenMoore(double[] data, int nOutliers)
|
|
public static ArrayList<Object> upperOutliersTietjenMoore(double[] data, int nOutliers)
|
|
public static double getTietjenMooreCriticalL(int nOutliers, int nObservations, int nSimulations, double significance) |
|
public static double getTietjenMooreCriticalL(int nOutliers, int nObservations, double significance) |
|
public static double getTietjenMooreLowerCriticalL(int nOutliers, int nObservations, int nSimulations, double significance) |
|
public static double getTietjenMooreLowerCriticalL(int nOutliers, int nObservations, double significance) |
|
public static double getTietjenMooreUpperCriticalL(int nOutliers, int nObservations, int nSimulations, double significance) |
|
public static double getTietjenMooreUpperCriticalL(int nOutliers, int nObservations, double significance) |
|
Generalised ESD (Extreme Studentisied Deviate) Test
|
Instant methods
|
public ArrayList<Object> outliersESD(int nOutliers)
|
|
Static methods
|
public static ArrayList<Object> outliersESD(double[] data, int nOutliers)
|
|
public static double[] getESDlambdas(intrPoints, int nPoints, double significance)
|
|
Dixon’s Q Test
|
Instant methods
|
public ArrayList<Object> outlierDixon(int a, int b);
|
public ArrayList<Object> outlierDixon();
|
|
public ArrayList<Object> lowerOutlierDixon(int a, int b);
|
public ArrayList<Object> lowerOutlierDixon();
|
|
public ArrayList<Object> upperOutlierDixon(int a, int b);
|
public ArrayList<Object> upperOutlierDixon();
|
|
Number of simulations
|
public void resetNumberDixonSimulations(int nSimulations) |
|
public int getNumberDixonSimulations() |
|
Static methods
|
public static ArrayList<Object> outlierDixon(double[] data, int a, int b)
|
|
public static ArrayList<Object> outlierDixon(double[] data)
|
|
public static ArrayList<Object> lowerOutlierDixon(double[] data, int a, int b)
|
|
public static ArrayList<Object> lowerOutlierDixon(double[] data)
|
|
public static ArrayList<Object> upperOutlierDixon(double[] data, int a, int b)
|
|
public static ArrayList<Object> upperOutlierDixon(double[] data)
|
|
public static double getDixonOneTailedCriticalQ(int a, int b, int nPoints, int nSimulations, double significance)
|
|
public static double getDixonOneTailedCriticalQ(int a, int b, int nPoints, double significance)
|
|
public static double getDixonOneTailedCriticalQ(int nPoints, int nSimulations, double significance)
|
|
public static double getDixonOneTailedCriticalQ(int nPoints, double significance)
|
|
public static double getDixonTwoTailedCriticalQ(int a, int b, int nPoints, int nSimulations, double significance)
|
|
public static double getDixonTwoTailedCriticalQ(int a, int b, int nPoints, double significance)
|
|
public static double getDixonTwoTailedCriticalQ(int nPoints, int nSimulations, double significance)
|
|
public static double getDixonTwoTailedCriticalQ(int nPoints, double significance)
|
|
public int[] ignoredIndicesLowerTest(int a, int b, int nPoints) |
|
public int[] ignoredIndicesUpperTest(int a, int b, int nPoints) |
|
Data |
Get entered data as doubles
|
public double[] getOriginalData()
|
|
public double[] getOrderedOriginalData()
|
|
public double[] getDataOrderStatisticMedians()
|
|
Get data stripped of outliers
|
public double[] getStrippedData()
|
|
public double[] getOrderedStrippedData()
|
|
public double[] getStrippedDataOrderStatisticMedians()
|
| element 0 | (boolean) | true if an outlier identified, false if not |
| element 1 | (double) | the value of the outlier if an outlier identified, NaN if not |
| element 2 | (int) | the index of the outlier if an outlier identified, -1 if not |
| element 3 | (double[]) | the data array with the outlier removed, the original data array if no outlier identified |
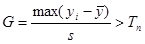
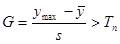
| element 4 | (double) | Grubbs’ G value |
| element 5 | (double) | Grubbs’ Tn value |
| element 6 | (double) | significance level used |
| element 7 | (int) | number of data points |
| element 8 | (double) | gradient of a Gaussian probability plot of the entered data |
| element 9 | (double) | intercept of a Gaussian probability plot of the entered data |
| element 10 | (double) | correlation coefficient, r, of a Gaussian probability plot of the entered data |
| element 11 | (double) | critical value for the correlation coefficient, r, of a Gaussian probability plot of the entered data at the significance level returned as element 6 |
| element 12 | (double) | gradient of a Gaussian probability plot of the data with the outlier removed if outlier found, NaN otherwise |
| element 13 | (double) | intercept of a Gaussian probability plot of the data with the outlier removed if outlier found, NaN otherwise |
| element 14 | (double) | correlation coefficient, r, of a Gaussian probability plot of the data with the outlier removed if outlier found, NaN otherwise |
| element 15 | (double) | critical value for the correlation coefficient, r, of a Gaussian probability plot of the data with the outlier removed at the significance level returned as element 6 if outlier found, NaN otherwise |
| element 16 | (double) | Shapiro-Wilk W value for the entered data |
| element 17 | (double) | Critical value of the Shapiro-Wilk W value for the entered data at at the significance level returned as element 6 |
| element 18 | (double) | Shapiro-Wilk p value for the entered data |
| element 19 | (double) | Shapiro-Wilk W value for the data with the outlier removed if outlier found, NaN otherwise |
| element 20 | (double) | Critical value of the Shapiro-Wilk W value for the data with the outlier removed at at the significance level returned as element 6 if outlier found, NaN otherwise |
| element 21 | (double) | Shapiro-Wilk p value for the data with the outlier removed if outlier found, NaN otherwise |
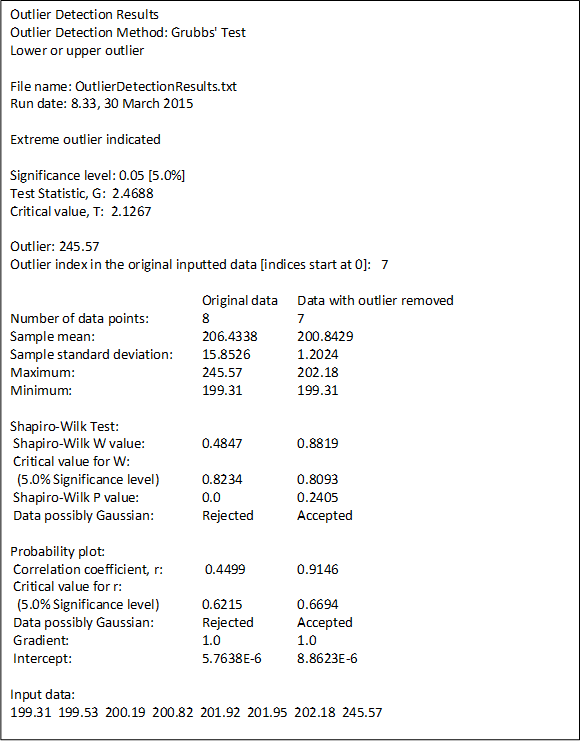
This method also prints the above analysis to a text file,
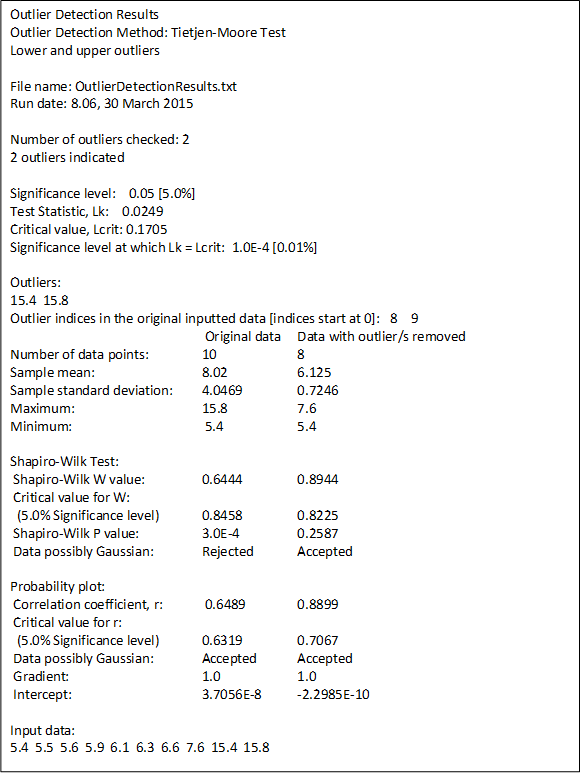
| element 0 | (boolean) | true if outliers identified, false if not |
| element 1 | (double[]) | the value of the data points chosen as potential outliers [outliers if element 0 is true] |
| element 2 | (int[]) | the indices of the potential/identified outliers. |
| element 3 | (double[]) | the data array with the outliers removed, the original data array if no outliers identified |
| element 4 | (double) | data sample Lk value |
| element 5 | (double) | simulation Lcrit value |
| element 6 | (double) | significance level used |
| element 7 | (double) | significance level at which Lk = Lcrit |
| element 8 | (int) | number of data points |
| element 9 | (int) | number of outliers/possible outliers |
| element 10 | (double) | gradient of a Gaussian probability plot of the entered data |
| element 11 | (double) | intercept of a Gaussian probability plot of the entered data |
| element 12 | (double) | correlation coefficient, r, of a Gaussian probability plot of the entered data/td> |
| element 13 | (double) | critical value for the correlation coefficient, r, of a Gaussian probability plot of the entered data at the significance level returned as element 6 |
| element 14 | (double) | gradient of a Gaussian probability plot of the data with the outlier removed if outlier/s found, NaN otherwise |
| element 15 | (double) | intercept of a Gaussian probability plot of the data with the outlier removed if outlier/s found, NaN otherwise |
| element 16 | (double) | correlation coefficient, r, of a Gaussian probability plot of the data with the outlier removed if outlier/s found, NaN otherwise |
| element 17 | (double) | critical value for the correlation coefficient, r, of a Gaussian probability plot of the data with the outlier removed at the significance level returned as element 6 if outlier/s found, NaN otherwise |
| element 18 | (double) | Shapiro-Wilk W value for the entered data |
| element 19 | (double) | Critical value of the Shapiro-Wilk W value for the entered data at at the significance level returned as element 6 |
| element 20 | (double) | Shapiro-Wilk p value for the entered data |
| element 21 | (double) | Shapiro-Wilk W value for the data with the outlier removed if outlier found, NaN otherwise |
| element 22 | (double) | Critical value of the Shapiro-Wilk W value for the data with the outlier removed at at the significance level returned as element 6 if outlier found, NaN otherwise |
| element 23 | (double) | Shapiro-Wilk p value for the data with the outlier removed if outlier found, NaN otherwise |
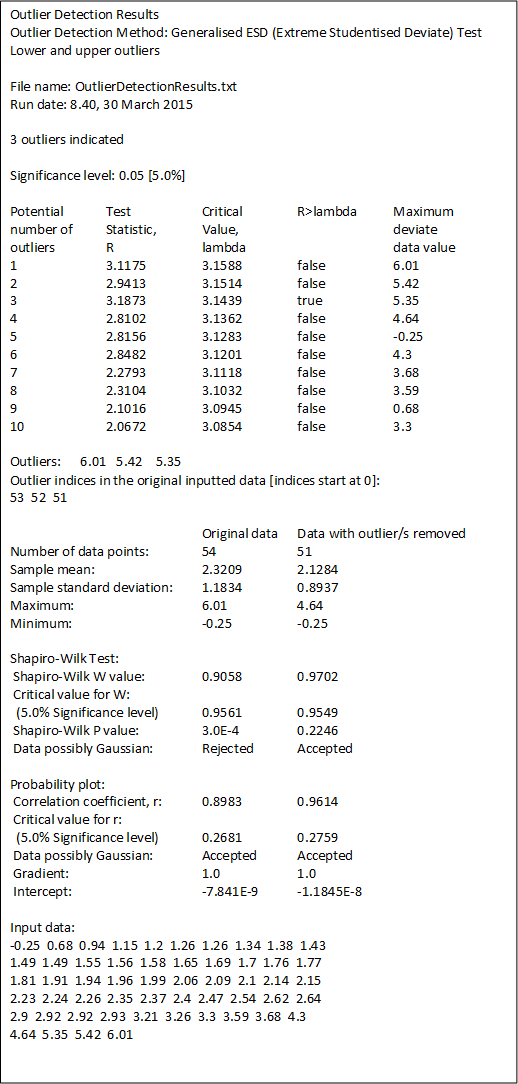
| element 0 | (boolean) | true if outliers identified, false if not |
| element 1 | (double[]) | the values of the data points indicated as outliers; null if no outliers indicated |
| element 2 | (int[]) | the indices of the identified outliers; null if no outliers indicated |
| element 3 | (double[]) | the data array with the outliers removed, the original data array if no outliers identified |
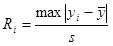
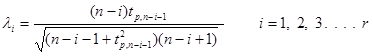
| element 4 | (double) | Test Statistics Ri value |
| element 5 | (double) | Critical Values λi |
| element 6 | (double) | true or false values for Ri > λi |
| element 7 | (double) | data values for the maximum ESDs |
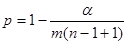
| element 8 | (double) | significance level used |
| element 9 | (int) | number of data points |
| element 10 | (int) | number of points tested as possible outliers |
| element 11 | (double) | gradient of a Gaussian probability plot of the entered data |
| element 12 | (double) | intercept of a Gaussian probability plot of the entered data |
| element 13 | (double) | correlation coefficient, r, of a Gaussian probability plot of the entered data |
| element 14 | (double) | critical value for the correlation coefficient, r, of a Gaussian probability plot of the entered data at the significance level returned as element 6 |
| element 15 | (double) | gradient of a Gaussian probability plot of the data with the outlier removed if outlier/s found, NaN otherwise |
| element 16 | (double) | intercept of a Gaussian probability plot of the data with the outlier removed if outlier/s found, NaN otherwise |
| element 17 | (double) | correlation coefficient, r, of a Gaussian probability plot of the data with the outlier/s removed if outlier found, NaN otherwise |
| element 18 | (double) | critical value for the correlation coefficient, r, of a Gaussian probability plot of the data with the outlier removed at the significance level returned as element 6 if outlier found, NaN otherwise |
| element 19 | (double) | Shapiro-Wilk W value for the entered data |
| element 20 | (double) | Critical value of the Shapiro-Wilk W value for the entered data at at the significance level returned as element 6 |
| element 21 | (double) | Shapiro-Wilk p value for the entered data |
| element 22 | (double) | Shapiro-Wilk W value for the data with the outlier removed if outlier found, NaN otherwise |
| element 23 | (double) | Critical value of the Shapiro-Wilk W value for the data with the outlier removed at at the significance level returned as element 6 if outlier found, NaN otherwise |
| element 24 | (double) | Shapiro-Wilk p value for the data with the outlier removed if outlier found, NaN otherwise |
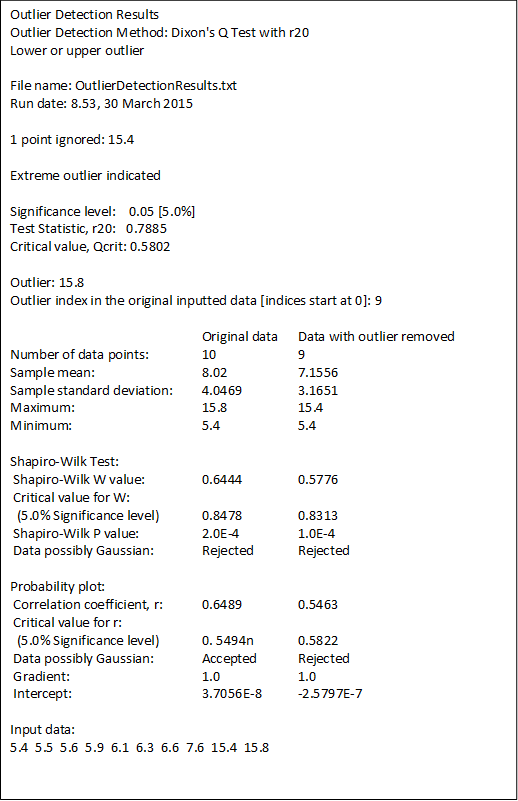
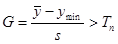
| element 0 | (boolean) | true if outliers identified, false if not |
| element 1 | (double) | the value of outlier; NaN if no outlier found |
| element 2 | (int) | the index of the outlier point; -1 if no outlier found. |
| element 3 | (double[]) | the data array with the outliers removed, the original data array if no outliers identified |
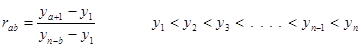
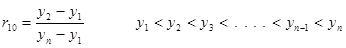
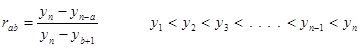
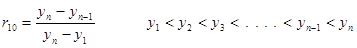
| element 4 | (double) | data sample rab value |
| element 5 | (double) | simulation Qcrit value |
| element 6 | (double) | significance level used |
| element 7 | (int) | number of data points |
| element 8 | (int) | value of a in rab |
| element 9 | (int) | value of b in rab |
| element 10 | (int) | number of points ignored |
| element 11 | (double[]) | values of ignored points; null if no points ignored |
| element 12 | (double) | gradient of a Gaussian probability plot of the entered data |
| element 13 | (double) | intercept of a Gaussian probability plot of the entered data |
| element 14 | (double) | correlation coefficient, r, of a Gaussian probability plot of the entered data |
| element 15 | (double) | critical value for the correlation coefficient, r, of a Gaussian probability plot of the entered data at the significance level returned as element 6 |
| element 16 | (double) | gradient of a Gaussian probability plot of the data with the outlier removed if outlier found, NaN otherwise |
| element 17 | (double) | intercept of a Gaussian probability plot of the data with the outlier removed if outlier found, NaN otherwise |
| element 18 | (double) | correlation coefficient, r, of a Gaussian probability plot of the data with the outlier removed if outlier found, NaN otherwise |
| element 19 | (double) | critical value for the correlation coefficient, r, of a Gaussian probability plot of the data with the outlier removed at the significance level returned as element 6 if outlier found, NaN otherwise |
| element 20 | (double) | Shapiro-Wilk W value for the entered data |
| element 21 | (double) | Critical value of the Shapiro-Wilk W value for the entered data at at the significance level returned as element 6 |
| element 22 | (double) | Shapiro-Wilk p value for the entered data |
| element 23 | (double) | Shapiro-Wilk W value for the data with the outlier removed if outlier found, NaN otherwise |
| element 24 | (double) | Critical value of the Shapiro-Wilk W value for the data with the outlier removed at at the significance level returned as element 6 if outlier found, NaN otherwise |
| element 25 | (double) | Shapiro-Wilk p value for the data with the outlier removed if outlier found, NaN otherwise |
This method also prints the above analysis to a text file, 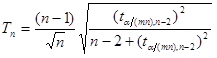
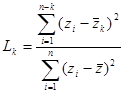

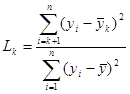
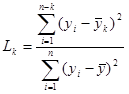
 are both the sample data mean and
  is the mean of the sample data with the largest k z points removed. Lcrit is determined by simulation. The simulation is performed by generating a standard normal random sample of size n and computing the Lk statistic. This simulation is performed m times. The default value of m is 10000. This default value may be altered [see Simulation number]. The value of Lcrit is obtained from this reference distribution. The value of the test statistic L lies between zero and one. In the absence of outliers the test statistic approaches 1. In the presence of outliers the test statistic approaches zero. The test is a lower, one-tailed test.