|
| Constructors | public ImmunoAssay() | ||
| public ImmunoAssay(String title) | |||
| public ImmunoAssay(double[] analyteConcns, double[] responses) | |||
| public ImmunoAssay(double[] analyteConcns, double[] responses, String title) | |||
| public ImmunoAssay(double[] analyteConcns, double[] responses, double[] weights) | |||
| public ImmunoAssay(double[] analyteConcns, double[] responses, double[] weights, String title) | |||
| public ImmunoAssay(double[] analyteConcns, double[] responses, double[] xErrors, double[] yErrors) | |||
| public ImmunoAssay(double[] analyteConcns, double[] responses, double[] xErrors, double[] yErrors, String title) | |||
| Enter the analyte concentrations | public void enterAnalyteConcns(double[] analyteConcns) | ||
| public void enterAnalyteConcnsAsLog10(double[] analyteConcns) | |||
| public void enterAnalyteConcnsAsLogE(double[] analyteConcns) | public double[] getAnalyteConcns() | ||
| Enter the responses | public void enterResponses(double[] responses) | ||
| public void enterResponsesAsLog10(double[] responses) | |||
| public void enterResponsesAsLogE(double[] responses) | public double[] getResponses() | ||
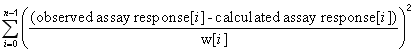
| Weighting factors | Enter as uncertaintities | public void enterWeights(double[] weights) | |
| public void enterWeightsAsLog10(double[] weights) | |||
| public void enterWeightsAsLogE(double[] weights) | |||
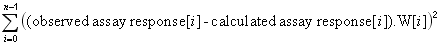
| Enter as multiplicative factors | public void enterMultiplicativeWeights(double[] weights) | ||
| public void enterMultiplicativeWeightsAsLog10(double[] weights) | |||
| public void enterMultiplicativeWeightsAsLogE(double[] weights) | |||
| Calculate from the response values | public void setWeightsAsResponses() | ||
| public void setWeightsAsSqrtResponses() | Set weights as true errors | public void setErrorsAsSD(); | |
| public void setErrorsAsScaled(); | |||
| Return the weighting factors | public double[] getWeights() | ||
| Read assay curve data from a text file | public void readFromFile() | ||
| public void readFromFile(String filename) | |||
| Enter a title | public void enterTitle(String title) | public String getTitle() | |
| Reset plotting option | public void resetPlotOption(int option) | ||
| Set data | public void setData() | ||
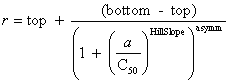
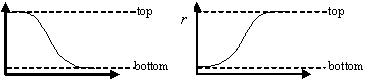
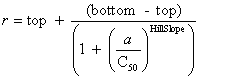
| Curve fitting | Fit to an equation | Five parameter logistic function | public void fiveParameterLogisticFit() |
| public void fiveParameterLogisticFit(double bottom, double top) | |||
| Four parameter logistic function | public void fourParameterLogisticFit() | ||
| public void fourParameterLogisticFit(double bottom, double top) | |||
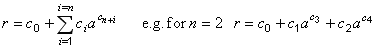
| Best fit polynomial | public int bestPolynomialFit() | ||
| Polynomial of given degree | public void polynomialFit(int degree) | ||
| Non-integer polynomial | public void nonIntegerPolynomialFit(int nTerms) | ||
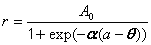
| Sigmoid threshold function | public void sigmoidThresholdFit() | ||
| Sips sigmoid function | public void sipsSigmoidFit() | ||
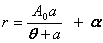
| Shifted rectangular hyperbola | public void shiftedRectangularHyperbolaFit() | ||
| Rectangular hyperbola | public void rectangularHyperbolaFit() | ||
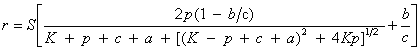
| Mass action model | ‘Amersham’ model | public void amershamFit() | |
| public void amershamFit(double[] estimates) | |||
| Interpolation | Cubic spline interpolation | public void cubicSpline() | |
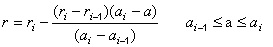
| Linear interpolation | public void linearInterpolation() | ||
| Select a fitting method via a dialogue box | public void selectEquation() | ||
| Print an analysis of the goodness of fit | public void print(String filename) | ||
| public void print() | |||
| Compare goodness of fit to two equations | The pair of equations entered within the program coding | public double compare(int equationIndex1, int equationIndex2) | |
| public double compare(int equationIndex1, int equationIndex2, double significance) | |||
| public double compare(int equationIndex1, int equationIndex2, String filename) | |||
| public double compare(int equationIndex1, int equationIndex2, double significance, String filename) | |||
| The pair of equations selected via a dialogue box | public double compare() | ||
| public double compare(double significance) | |||
| public double compare(String filename) | |||
| public double compare( double significance, String filename) | |||
| Return the concentration for a given response value | Return the concentration | public double getSampleConcn(double response) | |
| Return the estimated error | public double getSampleConcnError() | ||
| Model parameter estimates | Parameter values | public double[] getModelParameterValues() | |
| Estimated parameter errors | public double[] getModelParameterErrors() | ||
| Outlier detection | Confidence interval | public void[] setNintyNineLevel() | |
| public void[] setNintyFiveLevel() | |||
| Fitted standard curve | Reset number of points | public void resetNfittedCurve(int nPoints) | |
| Return working concentration range | public double[] getWorkingConcentrationRange() | ||
| Return working response range | public double[] getWorkingResponseRange() | ||
| Return fitted curve concentrations | public double[] getFittedStandardCurveConcns() | ||
| Return fitted curve responses | public double[] getFittedStandardCurveResponses() | ||
| Return number of turning points | public int getNumberOfTurningPoints() | ||
| Return turning point concentrations | public double[] getTurningPointConcns() | ||
| Return turning point responses | public double[] getTurningPointResponses() | ||
| Ancillary methods | Monotonicity | Check monotonicity | public static boolean isMonotonic(double[] data) |
| Surface concentrations | Surface molar concentration | public static double surfaceMolarConcn(double effectiveRadius) | |
| public static double surfaceMolarConcn(double molWeight, double specVolume) | |||
| Surface number concentration | public static double surfaceNumberConcn(double effectiveRadius) | ||
| public static double surfaceNumberConcn(double molWeight, double specVolume) | |||
| Equivalent molar volume concentration | public static double equivalentVolumeConcn(double effectiveRadius, double area, double volume) | ||
| public static double equivalentVolumeConcn(double molWeight, double area, double volume, double specVolume) | |||
| public static double convertSurfaceToVolumeConcn(double surfaceConcn, double area, double volume) | |||
| Molecular radius | public static double molecularRadius(double molWeight, double specVol) | ||
| public static double molecularRadius(double molWeight) | |||
| public static double effectiveRadius(double diffusionCoefficient, double viscosity, double temperature) | |||
| Molecular weights | IgG1 | public static double getMolWeightIgG1() | |
| IgG2 | public static double getMolWeightIgG2() | ||
| IgG3 | public static double getMolWeightIgG3() | ||
| IgG4 | public static double getMolWeightIgG4() | ||
| IgM | public static double getMolWeightIgM() | ||
| IgA1 | public static double getMolWeightIgA1() | ||
| IgA2 | public static double getMolWeightIgA2() | ||
| IgD | public static double getMolWeightIgD() | ||
| IgE | public static double getMolWeightIgE() | ||